Directions – Study the information and answer the questions that follow.
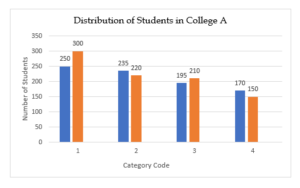
The bar graph shows the distribution of students in various categories in College A, in Year I (blue bar) and Year II (orange bar).

The categories are defined as under:

Directions – Study the information and answer the questions that follow.
The bar graph shows the distribution of students in various categories in College A, in Year I (blue bar) and Year II (orange bar).

The categories are defined as under:

| 1. What percentage of the total students are seniors in Year I? | Easy |
| A. 20% B. 17% C. 15% D. None of these |
Answer: Option A
Explanation:
| 2. If the number of students in category 1 grew by x% from Year I to Year II, and the number of students in category 3 grew by y% from Year I to Year II, then what is x: y? | Medium |
| A. 5/3 B. 13/5 C. 13/7 D. None of these |
Answer: Option B
Explanation:
x = ((300-250)/250) = 1/5
y = ((210-195)/195) = 1/13
x: y = (1/5)/(1/13) = 13/5
| 3. Which category has shown the greatest percentage increase or decrease from Year I to Year II and how much? | Medium |
| A. Category 4, 11.76% decrease B. Category 1, 16.67 % increase C. Category 1, 20 % increase D. None of these |
Answer: Option C
Explanation:
Category 1 = ((300-250)/250) * 100 = 20% increase
Category 2 = ((235 – 220)/235) * 100 = 6.38% decrease
Category 3 = ((210-195)/195) * 100 = 7.69% increase
Category 4 = ((170 – 150)/ 170) * 100 = 11.76% decrease
| 4. Which of the following is/are true?
I. The total number of students in College A in Year II has dipped as compared to that in Year I. II. If there is another College B, where the number of students in Year I in each category is 20% less than the respective categories in College A; while the number of students in College B in Year II is 20% more than its respective categories in Year I, then in College B the number of students in Year II is more than that of College A in the same year. |
Difficult |
| A. I only B. II only C. Both I & II D. Neither I nor II |
Answer: Option D
Explanation:
I. Total number of students in College A in year I = 850
Total number of students in College A in year II = 880
Thus, statement I is false.
II. Total number of students in College B in year I = 850 * 0.8 = 680
Total number of students in College B in year II = 680 * 1.2 = 816
But in College A, the number of students in Year II is 880; hence false.
| 5.In College A in Year III, the number of students has:
i. increased in category 1 by 30% as compared to its respective number in Year I. ii. decreased in category 2 by 35% as compared to its respective number in Year II. iii. decreased in category 3 by 10% as compared to its respective number in Year II. iv. increased in category 4 by 40% as compared to its respective number in Year I. What is the difference in the total number of students in Year III and Year I? |
Medium |
| A. 199 B. 169 C. 209 D. None of these |
Answer: Option A
Explanation:
Number of students in category 1 in Year III =250 * 1.3 = 325
Number of students in category 2 in Year III = 220 * 1.35 = 297
Number of students in category 3 in Year III = 210 * 0.9 = 189
Number of students in category 4 in Year III = 170 * 1.4 = 238
-> Total number of students in Year III in College A = 1049
Difference = 1049 – 850 = 199