Directions: Read the information and answer the questions that follow.

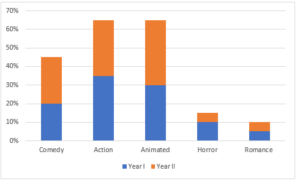
The bar graph below represents the percentage of movies owned by Family A in September of Year I and Year II. Assume that the first day of September of Year I is a Sunday, and that both Year I and Year II are non-leap years. Note that the opening day of a week in a month depends on the first day of that month. For example, each week of September of Year I will be from Sunday – Saturday.

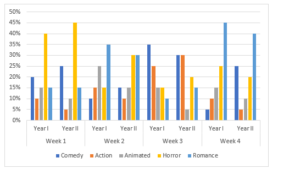
The bar graph below shows the distribution of movie time among the various movie genres in the first 4 weeks (28 days) of September of Year I and Year II.

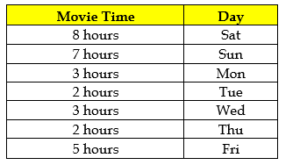
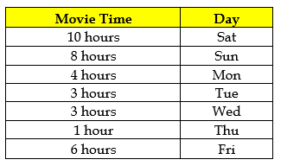
It is further known that movies are watched on all 30 days of the month in both the years. The distribution of day wise time for watching movies by the family for September of Year I is given in the table below:

1. If the total movies owned by Family A in September of Year I and Year II are in the ratio 3:2, then by what percentage are the action movies owned by the family in Year I less/more than the comedy movies owned by the family in Year II? Medium
A. 110% more
B. 110% less
C. 52.8% more
D. None of these

View Answer

Answer: Option A

Explanation:

Let the total movies owned by Family A in Year I = 3x
-> Total movies owned by Family A in Year II = 2x
Action movies owned in Year I = 0.35*3x = 1.05x
Comedy movies owned in Year II = 0.25*2x = 0.5x

Required percentage = ((1.05x – 0.5x)/0.5x)*100 = 110%

2. How many less/more hours does the family watch romance movies in Week 2 of September of Year I as compared to horror movies in Week 3 of September of Year II? It is given that the family spends two hours more every day in September of Year II for watching movies as compared to the respective days in Year I. Difficult
A. 1 hour 30 minutes more
B. 1 hour 42 minutes more
C. 1 hour 42 minutes less
D. None of these

View Answer

Answer: Option B

Explanation:

The family watches movies for 30 hours in a week in Year I (from the table). Since the movie time is 2 hours/day more in September of Year II, the family watches movies for 44 (=30+14) hours in a week in Year II.

Number of hours spent in watching romance movies in Week 2 of September of Year I =0.35*30 = 10.5 hours = 10 hours 30 minutes

Number of hours spent in watching horror movies in Week 3 of September of Year II =0.2*44 = 8.8 hours = 8 hours 48 minutes

Required difference = 10 hours 30 minutes -8 hours 48 minutes =1 hour 42 minutes

3. By what percentage is the time for watching animated movies in the last two days of September of year I less/more, as compared to the time for watching action movies in these two days of September of Year II? The following assumptions are made:
i. The family follows the same day wise pattern for watching movies in September of Year II as that for September of Year I.
ii. On each day of a week in September of both the years, the time for watching movies of all genres is split in the same percentage as that for the entire week.
iii. The last two days follow the same percentage distribution of movie time as Week 1 of the month.
Difficult
A. 83.33%
B. 300%
C. 500%
D. None of these

View Answer

Answer: Option C

Explanation:

The first day of September of Year I is a Sunday.
-> Last two days of September of year I will be Sunday and Monday. Total time for watching movies on these two days = 7+3 = 10 hours
-> Time spent in watching animated movies on the last two days of September of Year I= 0.15*10 = 1.5 hours
Similarly, the first day of September of Year II is a Monday.
-> Last two days of September of year II will be Monday and Tuesday. Total time for watching movies on these two days = 3+2 = 5 hours
-> Time spent in watching action movies on the last two days of September of Year II = 0.05*5= 0.25 hours

Required percentage = ((1.5-0.25)/0.25)*100 = 500%


Directions for Q4 and Q5:

Suppose that there is another Family B which also owns the same genres of movies in September of Year I and II as that owned by Family A, such that:

i. Comedy movies owned by B in Year I are 5 percentage points more, and comedy movies in Year II are 5 percentage points less than that owned by A.

ii. Action movies owned by B in Year I are 20% less, and action movies in Year II are 20% more than that owned by A.

iii. Animated movies owned by B in Year I are 3 percentage points less, and animated movies in Year II are 20% less than that owned by A.

iv. Horror movies owned by B in Year I are 30% more, and horror movies in Year II are 2 percentage points more than that owned by A.

4. How many more (in percentage) romance movies does Family A own as compared to Family B in Year I & II together, if A and B own the same number of movies in each of the years and the ratio of the total movies owned by A and B in each of the years is 7:3 respectively? Difficult
A. 45.83%
B. 31.42%
C. 53.25%
D. None of these

View Answer

Answer: Option A

Explanation:

Let the total movies owned by Family A in Years I & II be 7x and 7x
-> Total movies owned by Family B in Years I & II will be 3x and 3x.
Romance movies owned by A in Year I = 0.05*7x = 0.35x
Romance movies owned by A in Year II = 0.05*7x = 0.35x
Total romance movies owned by A in Year I+II = 0.7x

Now, comedy movies owned by B in Year I = 20+5 = 25%
Action movies owned by B in Year I = 35*0.8 = 28%
Animated movies owned by B in Year I = 30-3 = 27%
Horror movies owned by B in Year I = 10*1.3 = 13%
Thus, romance movies owned by B in Year I = 100-(25+28+27+13) = 7%
-> Romance movies owned by B in Year I = 0.07*3x = 0.21x

Similarly, comedy movies owned by B in Year II = 25-5 = 20%

Action movies owned by B in Year II = 30*1.2 = 36%
Animated movies owned by B in Year II = 35*0.8 = 28%
Horror movies owned by B in Year II = 5+2 = 7%
Thus, romance movies owned by B in Year II = 100-(20+36+28+7) = 9%
-> Romance movies owned by B in Year II = 0.09*3x = 0.27x
Thus, total romance movies owned by B in Year I+II = 0.21x+0.27x= 0.48x

Required percentage = ((0.7x – 0.48x)/0.48x)*100 = 45.83%


5. The distribution of day wise time for watching movies by Family B for September of Year I is given in the table below:

The week wise distribution in September of year I is such that Week 1 pattern for B is same as Week 3 for A; Week 2 is same as Week 4 for A; Week 3 is same as Week 2 for A; and Week 4 is same as Week 1 for A. How much more is the time spent by Family B in watching animated movies as compared to that spent by Family A in watching horror movies, in Week 3 of September of Year I?

Medium
A. 3 hours
B. 2.5 hours
C. 4 hours
D. None of these

View Answer

Answer: Option D

Explanation:

Total time spent by A in watching movies in Week 3 = 30 hours

-> Time spent by A in watching horror movies in week 3 = 0.15*30 = 4.5 hours

Total time spent by B in watching movies in Week 3 = 35 hours

-> Time spent by B in watching animated movies in week 3 = 0.25*36 = 9 hours

Required difference = 9-4.5 = 4.5 hours