Directions: Read the information and answer the questions that follow.

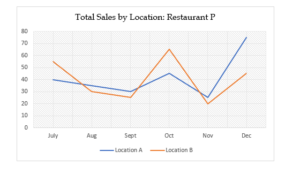
The line chart below indicates the total pizza sales, in thousands of dollars, for two different locations of restaurant P, over a six-month period in Year I.

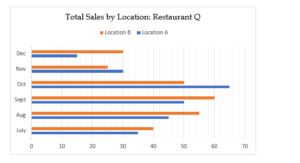
The bar graph below the total pizza sales, in thousands of dollars, for two different locations (same as that for restaurant P) of restaurant Q, over a six-month period in Year I.

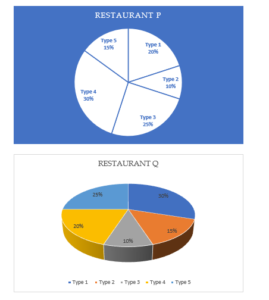
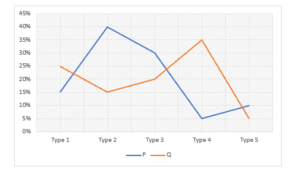
The pie charts below show the sales distribution for the month of September (Year I) for the 5 different types of pizzas sold by restaurants P and Q (assume same distribution at both the locations of a particular restaurant), which comprise the total sales of these restaurants in September (Year I):


1. Approximately how many more/less pizzas (in percentage) are sold by P as compared to Q in the quarter July-Sept of Year I? Medium
A. 25% less
B. 25% more
C. 33% less
D. None of these

View Answer

Answer: Option A

Explanation:

Pizzas sold by P are as under:

A B Total
July 40 55 95
Aug 35 30 65
Sept 30 25 55
215


Pizzas sold by Q are as under:

A B Total
July 35 40 75
Aug 45 55 100
Sept 50 60 110
285


Required % = ((215-285)/285)*100 = 24.56%

2. For which month and location, the percentage increase or decrease of sales as compared to the previous month, is the highest for restaurant P? Medium
A. Dec, B
B. Dec, A
C. Oct, B
D. None of these

View Answer

Answer: Option B

Explanation:

The percentage change of sales for various months at the two locations of P are given as under:

A B % Change A % Change B
July 40 55
Aug 35 30 -13 -45
Sept 30 25 -14 -17
Oct 45 65 50 160
Nov 25 20 -44 -69
Dec 75 45 200 125

For example, the % change for A for Dec = ((75-25)/25)*100 = 200%, which is the highest.

Note
One may simply arrive at the answer by a visual inspection of the slopes of the line graph, which is the steepest for Dec, location A.


3. In September (Year I), which location of which restaurant and which type of pizza, registers the highest sales? Difficult
A. Type 1, Q at A
B. Type 4, P at A
C. Type 5, Q at B
D. None of these

View Answer

Answer: Option D

Explanation:

We complete the table as shown below. For example, Type 1 for P at location A = 0.2*30 = 6 (thousands of dollars). Here 20% (from the pie chart) is the sales percentage at this location, while 30 (thousands of dollars) is the sales for P in the month of September (from the line graph). Similarly, the value of Type 1 for Q at location B = 0.3*60 = 18 (which is the highest). Here 30% (from the pie chart) is the sales percentage at this location, while 60 (thousands of dollars) is the sales for Q in the month of September (from the bar graph)

P Q
A B A B
Type I 6 5 15 18
Type 2 3 2.5 7.5 9
Type 3 7.5 6.25 5 6
Type 4 9 7.5 10 12
Type 5 4.5 3.75 12.5 15

From the table above, it is obvious that Type 1 for Q at location B has the highest sales.

Directions for Q4 and Q5:

 In the quarter Oct-Dec of Year II, the sales of pizzas, in thousands of dollars, for P and Q, at locations A and B, are given in the bar chart below:

The line chart below shows the sales distribution for the month of October (Year II) for the 5 different types of pizzas (types are same as that in September of Year I) sold by restaurants P and Q (assume same distribution at both the locations of a particular restaurant), which comprise the total sales of these restaurants in October (Year II):


4. If x pizzas are sold at location A of P and location B of Q in Year I in the quarter Oct-Dec, and y pizzas are sold at the same locations in Year II in the same quarter, then how much is x less/more than y (in percentage)? Medium
A. 11.11% more
B. 10% more
C. 9.11% more
D. None of these

View Answer

Answer: Option A

Explanation:

Pizzas sold at location A of P in Oct-Dec, Year I = 45+25+75= 145

Pizzas sold at location B of Q in Oct-Dec, Year I =50+25+30 = 105

x = 145+105 = 250 (thousands of dollars)

Pizzas sold at location A of P in Oct-Dec, Year II= 35+25+30 = 90

Pizzas sold at location B of Q in Oct-Dec, Year II=30+60+45= 135

y = 90+135 = 225 (thousands of dollars)

Required percentage = ((250-225)/225)*100 = 11.11%


5. Which type of pizza and at which location registers the highest percentage growth in sales in October of Year II as compared to that of September of Year I? Difficult
A. Type 3, location A at Q
B. Type 2, location A at P
C. Type 2, location B at P
D. None of these

View Answer

Answer: Option C

Explanation:

From Q3 we get the following table:

Year I – Sept
P Q
A B A B
Type I 6 5 15 18
Type 2 3 2.5 7.5 9
Type 3 7.5 6.25 5 6
Type 4 9 7.5 10 12
Type 5 4.5 3.75 12.5 15


Follow the same approach to get the table for October sales as under:

Year II – Oct
P Q
A B A B
Type I 5.25 6.75 11.25 7.5
Type 2 14 18 6.75 4.5
Type 3 10.5 13.5 9 6
Type 4 1.75 2.25 15.75 10.5
Type 5 3.5 4.5 2.25 1.5


Now, from the above two tables we get the required % increase as under:

P Q
A B A B
Type 1 -13 35 -25 -58
Type 2 367 620 -10 -50
Type 3 40 116 80 0
Type 4 -81 -70 58 -13
Type 5 -22 20 -82 -90


For example, the sales growth for Type 2 pizza at location B of restaurant P in October of Year II as compared to that in September of Year I = ((18-2.5)/2.5)*100)  = 620%.

From this table, we can observe that this is the highest %growth.