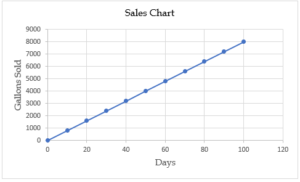
Directions – Study the information and answer the questions that follow.
The line graph shows the amount of ice cream sold at an ice cream store A in the first 100 days of its launch.

Directions – Study the information and answer the questions that follow.
The line graph shows the amount of ice cream sold at an ice cream store A in the first 100 days of its launch.

| 1. Which of the following is the closest estimate of the store’s rate of ice cream sales, in gallons per day? | Easy |
| A. 85 B. 80 C. 75 D. None of these |
Answer: Option B
Explanation:
To find the most accurate estimate of the rate, look for a point on the graphed line that aligns with the tick marks on both axes and will be easy to divide without a calculator. By visual inspection, the line passes through a point at exactly 8000 gallons and 100 days; so, the rate is 8000/100 = 80 gallons/day
| 2. The amount of ice cream sold in 72 days is x% more than that sold in 51 days. What is x? | Medium |
| A. 41.17% B. 31.17% C. 29.17% D. None of these |
Answer: Option A
Explanation:
The line chart shows a uniform rate of sales. Also, from Q1, the rate of ice cream sales is 80 gallons/day.
-> Amount of ice cream sold in 51 days = 51 * 80 = 4080 gallons
And, the amount of ice cream sold in 72 days = 72 * 80 = 5760 gallons
-> x = ((5760 – 4080)/4080) * 100 = 41.17%
| 3.One-fourth of the total sales per day comprises brand X, and the remaining comprises brands Y and Z in the ratio 2:3 respectively. How many gallons of brand Z were sold in 23 days? | Medium |
| A. 460 B. 552 C. 828 D. None of these |
Answer: Option C
Explanation:
Daily, 80 gallons of ice cream are sold.
-> Sale of brand X = 20 gallons/day
Sale of brand Y = (2/5) * 60 = 24 gallons
Sale of brand Z = 60 -24 = 36 gallons
-> Gallons of brand Z were sold in 23 days = 23 * 36 = 828 gallons
Directions for Q4 and Q5:
Suppose another ice cream store B is also launched such that its sales increase by 10 gallons every day for the first 20 days, and then the sales dips to follow the same daily sales as that for store A. It is also given that the sale at the end of the first day of lunch of store B was 15 gallons.
| 4. After how many days will the cumulative ice cream sales of the two stores be the same? | Difficult |
| A. 10 days B. 18 days C. 14 days D. 20 days |
Answer: Option C
Explanation:
Given, sale for first day for store B = 15 gallons
Thereafter, till the 20th day the daily sale increases by 10 gallons/day, which means that the sales pattern for the first 20 days can be given by the expression x+(n-1)d, where x = 15, d= 10 and n is the day for which the sales is to be calculated. For example, sale for day 3 = 15 + (3-1) 10 = 35 gallons. This means that the sales pattern for store B follows an arithmetic progression. Thus, the cumulative sales for n days for store B, where n ≤ 20, can be given by the expression n/2 (2x +(n-1)d).
Now, all options are for values less than or equal to 20 days. Let the sales of the two stores be equal after n days, then:
80n = n/2 (2*15 +(n-1)10)
-> n = 14
Alternatively
We may work backwards from the options.
For example, after 14 days, cumulative sale for store A = 14 * 80 = 1120 gallons, and cumulative sale for store B = 14/2(2*15 + (14-1) = 1120 gallons.
| 5. On the 21st day, the daily sales for store B shows a dramatic drop. What is the percentage drop in the daily sales for store B on the 21st day as compared to that on the 20th day? | Difficult |
| A. 60.97% B. 50.97% C. 156.25% D. None of these |
Answer: Option A
Explanation:
From Q4, the daily sales for store B on the nth day, where n is less than or equal to 20, is given by the expression x+(n-1)d, where x = 15, d= 10 and n is the day for which the sales is to be calculated.
-> Sale on 20th day for store B = 15 + (20-1)10 = 205 gallons
On the 21st day the sale is the same as that for store A = 80 gallons
Required percentage = ((80 – 205)/205) * 100 = -60.97%