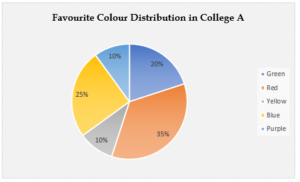
Directions – Study the information and answer the questions that follow.
Consider the following pie chart regarding the survey of a students in College A with respect to their favourite colour.

Directions – Study the information and answer the questions that follow.
Consider the following pie chart regarding the survey of a students in College A with respect to their favourite colour.

| 1. If 200 students were surveyed, how many more students picked red than picked yellow as their favourite colour? | Easy |
| A. 20 B. 70 C. 50 D. None of these |
Answer: Option C
Explanation:
Number of students who picked red = 0.35*200 = 70
Number of students who picked yellow = 0.1*200 = 20
Required number = 70-20 = 50
| 2. The angle subtended at the centre of the circle by the arc representing blue colour (as the favourite colour) is x degrees more than that representing the yellow colour. What is x (in degrees)? | Easy |
| A. 54 B. 36 C. 18 D. None of these |
Answer: Option A
Explanation:
Required angle = (0.25-0.1) *360
= 54 degrees
| 3. If the group choosing green colour as their favourite colour has 75% girls and 25% boys, and the group choosing purple as their favourite has 70% girls and 30% boys, then how many more boys chose green colour over purple if 400 students were surveyed in College A? | Medium |
| A. 20 B. 40 C. 16 D. None of these |
Answer: Option D
Explanation:
Group choosing green color = 0.2*400 = 80
Boys choosing green = 0.25*80 = 20
Group choosing purple = 0.1*400 = 40
Boys choosing purple = 0.3*40 = 12
Required number = 20-12 = 8
| 4. If in each group the number of girls that were surveyed was 1.5 times the number of boys, then what was the ratio of the number of boys who chose blue to the number of girls who chose both red and yellow? | Medium |
| A. 27:10 B. 10:27 C. 20:27 D. None of these |
Answer: Option B
Explanation:
Let the number of students surveyed be 100.
-> 25 students chose blue, out of which the number of boys = (2/5)*25 = 10
Similarly, 35 students chose red, out of which the number of girls who chose red = (3/5)*35 = 21
And, 10 students chose yellow, out of which the number of girls who chose yellow = (3/5)*10 = 6
-> Number of girls who chose both red and yellow = 21+6 = 27
Required ratio = 10: 27
| 5. Suppose the survey was extended to another College B, where the favourite colour distribution was such that: i. students who chose red were 10 percentage points more as compared to the corresponding percentage in College A; ii. students who chose yellow were 5 percentage points less as compared to the corresponding percentage in College A; iii. students who chose blue were 5 percentage points less as compared to the corresponding percentage in College A; iv. students who chose green were 20% more as compared to the corresponding percentage in College A; and v. students who chose purple were 40% less as compared to the corresponding percentage in College A. What is the ratio of the number of students in College A who chose non-red colours to the number of students in College B who chose non-yellow colours, given that the number of students surveyed in College B is 20% more than the number of students surveyed in College A? |
Difficult |
| A. 65:114 B. 65:103 C. 55:114 D. None of these |
Answer: Option A
Explanation:
In College B, the percentage distribution is as under:
Red = 35+10 = 45%
Yellow = 10-5 = 5%
Blue = 25-5 = 20%
Green = 1.2*20 = 24%
Purple = 0.6*10 = 6%
Let the number of students surveyed in College A = x
-> The number of students surveyed in College B = 1.2x
Break-up of the number of students who chose non-red colors in College A is as under:
Yellow = 0.1x
Blue = 0.25x
Green = 0.2x
Purple = 0.1x
Total A who chose non-red colors = 0.65x
Similarly, break-up of the number of students who chose non-yellow colors in College B is as under:
Red = 0.45*1.2x= 0.54x
Blue = 0.2*1.2x = 0.24x
Green = 0.24*1.2x = 0.288x
Purple = 0.06*1.2x = 0.072x
Total B who chose non-yellow colors = 1.14x
Required ratio = 0.65x: 1.14x = 65: 114