Directions – Study the information and answer the questions that follow.
The pie chart shows A’s household expenses for the month of June in Year X.
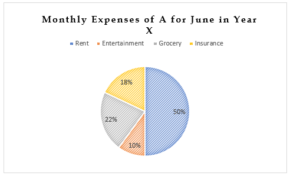

Directions – Study the information and answer the questions that follow.
The pie chart shows A’s household expenses for the month of June in Year X.
| 1. If A’s expenses for June in Year X total Rs 45000, how much more did he spend on grocery as compared to entertainment? | Easy |
| A. 1800 B. 1500 C. 1200 D. None of these |
Answer: Option A
Explanation:
Required amount = (0.22-0.18) * 45000 = 1800
| 2. What is the difference, in degrees, between the angles subtended at the centre of the pie by the arcs representing rent and entertainment? | Easy |
| A. 54 B. 36 C. 18 D. None of these |
Answer: Option A
Explanation:
1% = 3.6 degrees
-> Angle subtended at the center of the pie by the arc representing rent = 50*3.6 = 180
Also, angle subtended at the center of the pie by the arc representing entertainment = 10*3.6 = 36
Required difference = 180-36 = 144 degrees
| 3.Assume that A makes the entire payment in each of the expense categories by cash, debit card and credit card in the ratio 3:5:2 respectively. If he pays rupees P by cash for rent, rupees Q by cash for insurance, rupees R by debit card for entertainment, and rupees S by credit card for grocery, then approximately how much more, in percentage, is (P+Q) as compared to (R+S)? | Difficult |
| A. 117% B. 107% C. 67% D. None of these |
Answer: Option D
Explanation:
Suppose the total expense is Rs x
-> P = (3/10)* 0.5*x = 3x/20
Q = (3/10)*0.18x = 27x/500
P+Q= (3x/20)+(27x/500) = 102x/500
R = (5/10)*0.1x = x/20
S = (2/10)*0.22x = 22x/500
R+S = (x/20)+(22x/500) = 47x/500
-> Required percentage = (((102x/500)-47x/500))/(47x/500))*100
= 117.02%
Directions for Q4 and Q5:
Suppose that there is a similar expense distribution pie chart, with the same expense categories, for another person B for the month of June in year X, such that:
i. the arc representing insurance subtends an angle of 36 degrees at the centre;
ii. the sector representing grocery is 8 percentage points more than that in the expense distribution pie chart for A.
iii. the sector representing entertainment is 40% more than that in the expense distribution pie chart for A.
| 4. If B spends Rs 50000 in all towards his expenses in June, then how much more, in rupees, does he pay for rent as compared to that for entertainment? | Difficult |
| A. 18000 B. 16000 C. 8000 D. None of these |
Answer: Option B
Explanation:
Percentage expense break-up for B for June in Year X is as under:
Insurance = (36/360) * 100 = 10%
Grocery = 8+22 = 30%
Entertainment = 1.4*10 = 14%
Rent = 100-(10+30+14) = 46%
-> Required amount = (0.46-0.14)*50000 =16000
| 5. Assume that in the June of year Y, the percentage expense distribution pie for both A and B changes as under: i. Rent for B remains the same, while that for A increases by 10%. ii. Grocery for A decreases by 2 percentage points, while that for B increases by 40%. iii. Insurance for A is the same as that for B in year X, while that for B decreases by 5 percentage points. By what percentage is the entertainment expense for A in June of year Y more/less than that for B in June of that year if their total monthly expense is in the ratio 2:3 respectively. |
Difficult |
| A. 39.56% less B. 28.34% more C. 28.34% less D. None of these |
Answer: Option C
Explanation:
Percentage expense break-up for A for June in Year Y is as under:
Rent = 1.1*50 = 55%
Grocery = 22-2 = 20%
Insurance = 10%
Entertainment = 100-(55+20+10) = 15%
Percentage expense break-up for B for June in year Y is as under:
Rent = 46%
Grocery = 1.4*30 = 42%
Insurance = 10-5= 5%
Entertainment = 100-(46+42+5) = 7%
Let the expense for A in June of year Y = 2x
-> Expense for B in June of year Y = 3x
Entertainment expense for A = 1.15(2x) = 2.3x
Entertainment expense for B = 1.07(3x) = 3.21x
Required percentage = ((2.3x-3.21x)/3.21x)*100 = -28.34%