Directions: Read the information and answer the questions that follow.
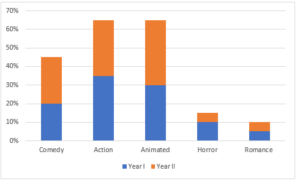
The bar graph below represents the percentage of movies owned by Family A in September of Year I and Year II. Assume that the first day of September of Year I is a Sunday, and that both Year I and Year II are non-leap years. Note that the opening day of a week in a month depends on the first day of that month. For example, each week of September of Year I will be from Sunday – Saturday.

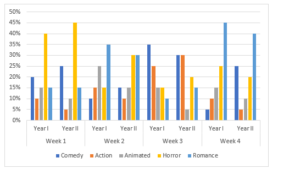
The bar graph below shows the distribution of movie time among the various movie genres in the first 4 weeks (28 days) of September of Year I and Year II.

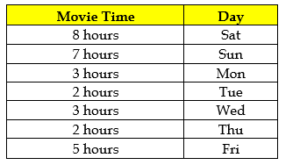
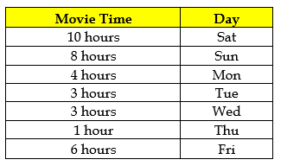
It is further known that movies are watched on all 30 days of the month in both the years. The distribution of day wise time for watching movies by the family for September of Year I is given in the table below:


